A note from Teo
Relative risk vs absolute risk: the two numbers behind every health headline
“Cuts your risk in half” can mean one person in a thousand or twenty in a hundred. How to find the two numbers that tell them apart.
A headline says a pill, a food or a habit cuts your risk in half. It sounds like a lot. Sometimes it is. Sometimes it is one person in a thousand. The headline uses the same word for both, so you need two numbers to tell them apart.
I'm Teo. I'm ninety-six, and I read health research the way some people do crosswords: slowly, with a pencil. This is the first thing I look for in any paper, and it takes about five minutes.
The two numbers
- The risk without it. Out of every 100 people who did not get the pill, food or habit, how many had the outcome? Papers call this group the control group, the placebo group or usual care.
- The risk with it. Out of every 100 people who did get it, how many had the same outcome, over the same length of time?
That's the whole method. Everything else in the article is decoration.
Relative risk: the number headlines like
Relative risk compares the two numbers as a fraction. Say 8 in 100 people had a heart attack without the pill and 4 in 100 had one with it. Four is half of eight, so the headline says the pill "cuts heart attacks by 50%". That is true.
Now say a rare illness went from 2 in 1,000 people to 1 in 1,000. One is half of two. The headline says "cuts the risk by 50%". Also true.
Same word, same percentage. Very different news. (Made-up numbers, real arithmetic.)
Absolute risk: the number that tells you the size
The absolute difference is one subtraction: the risk without it, minus the risk with it.
- First example: 8 minus 4 is 4 fewer people in every 100.
- Second example: 2 minus 1 is 1 fewer person in every 1,000, which is 0.1 in every 100.
Both are "half". One changes forty times more lives than the other. That's the number that tells you whether the thing is big.
One more sum: how many people for one to benefit
Divide 100 by the absolute difference per 100 and you get the number needed to treat: how many people take the thing for one of them to be spared the outcome.
- 100 divided by 4 is 25. Twenty-five people take the pill so that one avoids a heart attack.
- 1,000 divided by 1 is 1,000. A thousand people keep up the habit so that one avoids the illness.
Smaller is better. I wrote a whole note on this number, because it's the most useful sum in health reporting.
Why headlines prefer the relative number
It's bigger, and it's usually the number in the abstract. That's not always a trick. Many statistical methods produce a ratio (a hazard ratio, an odds ratio, a relative risk), so the ratio is what the authors report first. But a ratio on its own is half a fact. "50% lower" than what?
Where the paper keeps the absolute numbers
- The results table. One column per group, with the number of people in each group and the number who had the outcome, often called "events".
- Words to look for: events, incidence, absolute risk, risk difference, per 1,000 person-years.
- The time span. It's in the methods: "followed for a median of 5.2 years". Keep it next to the numbers.
Two traps
- A relative number with no absolute one. "Reduced risk by 30%" or "hazard ratio 0.7", and nothing else. Keep reading until you find the counts.
- A number with no time span. Two in a hundred over a year is not two in a hundred over ten years.
Try it this week
Take the next health headline you see and find the two numbers. If the article doesn't give them, find the paper. If the paper doesn't give them, that tells you something too.
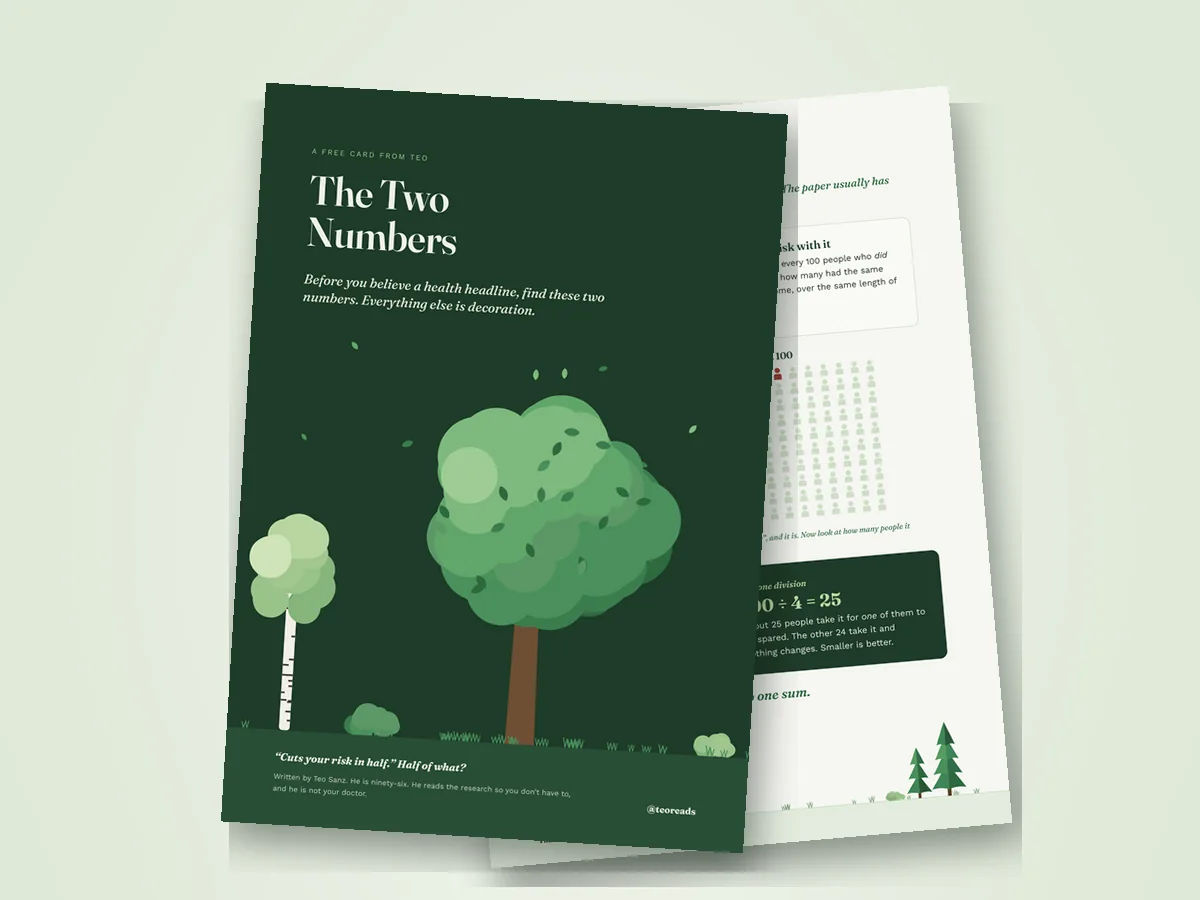
If you want this on the fridge, The Two Numbers is a free card that does exactly this, with three headlines taken apart. The other eleven questions I ask of every claim are in The Receipts Checklist.
This is education about reading research, not medical advice. Take your questions to someone who can examine you.